How to Divide a Search Area into Sectors
August 15, 2026
In this guide
- Draw a search area and split it into lettered sectors with the sector planner, right on the live map.
- Assign teams by painting squares, up to 12 colors over 1,000 squares.
- Copy a plain-text roster for the ICS‑204 and the radio log.
- Export the plan as an image, a true-scale PDF, or GeoJSON for GIS.
- No desktop GIS, no marker pen on a printout. About a minute, in the browser.
Draw the area
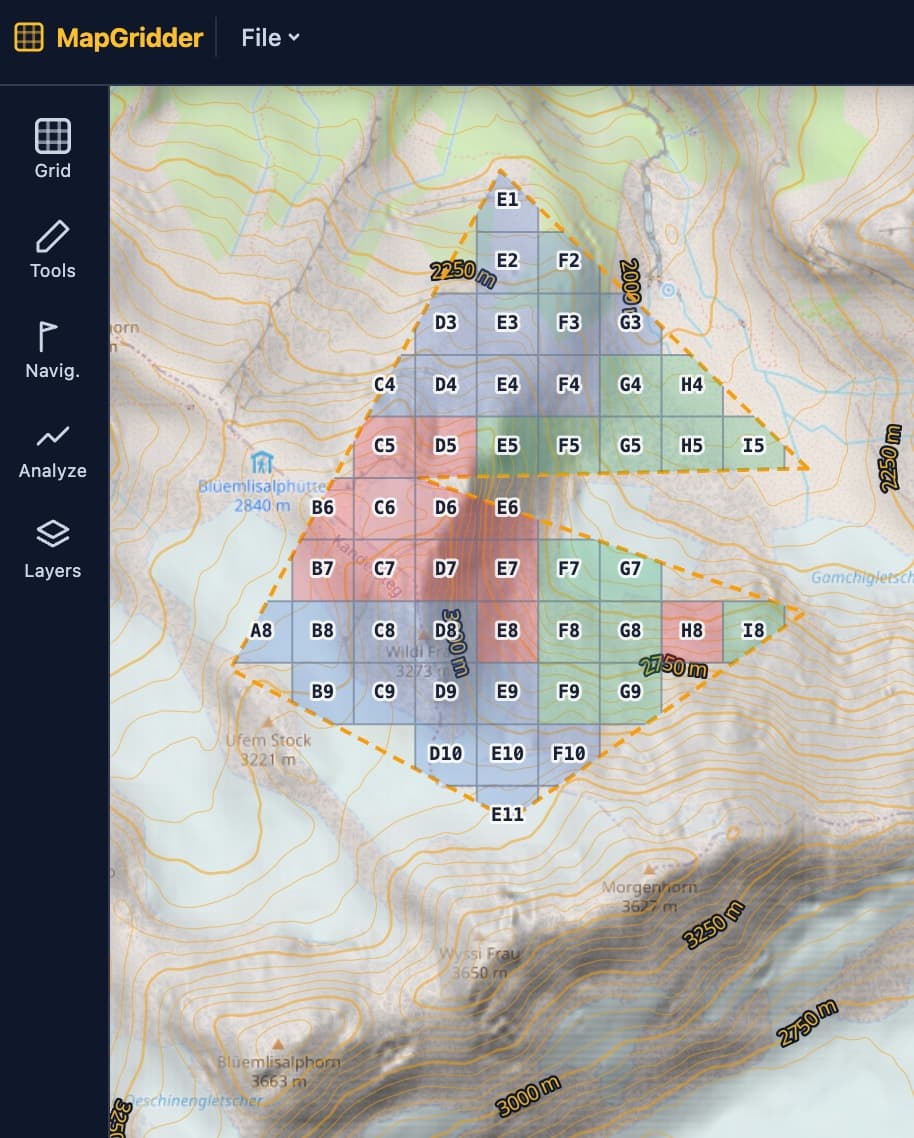
Outline the ground you are responsible for. Drag a rectangle when the tasking is a box. Click corner points for a polygon that follows a ridgeline, a road, or a drainage. If the screen already frames the problem, just take the current view. Only what you drew gets squared, so an odd-shaped search area does not drag empty ground into the count.
Split it into squares
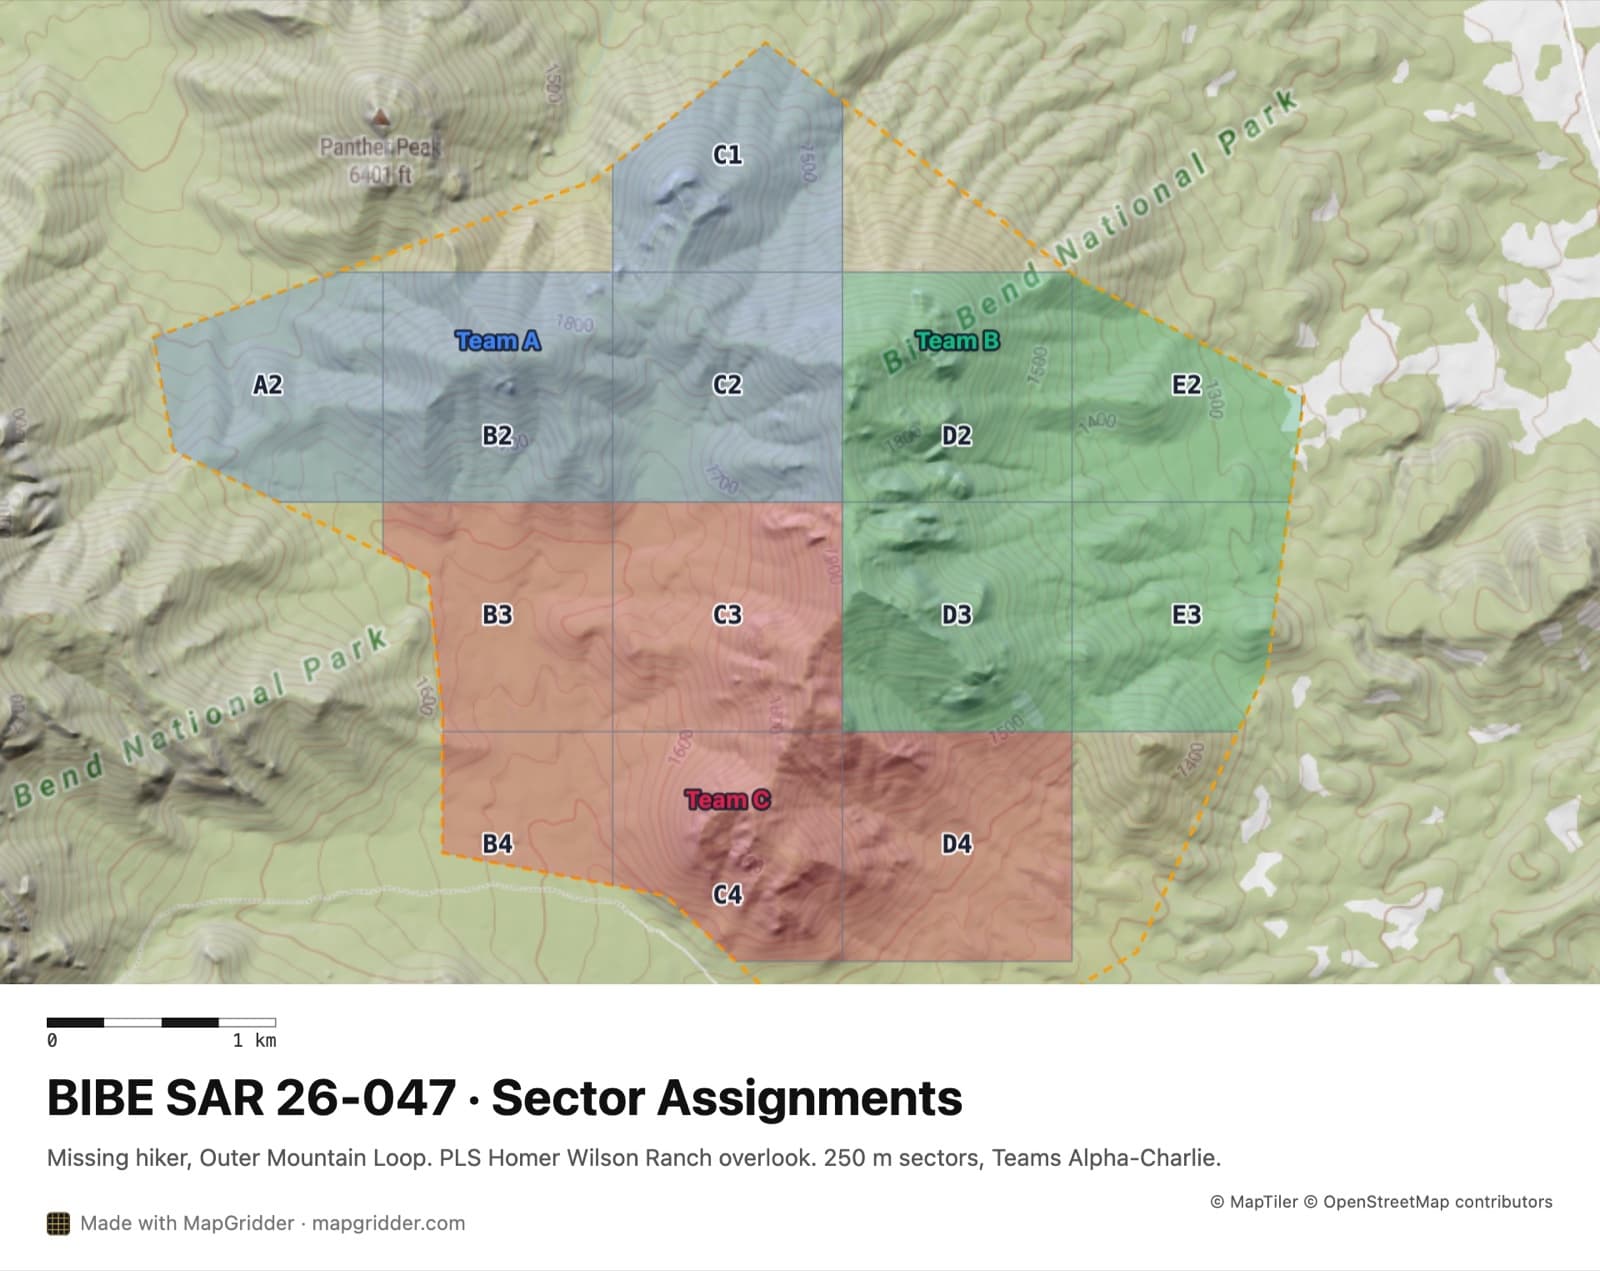
Set either the number of squares or the size of one square, and the two stay in step. Each square is one sector, the piece a team gets. Sizes snap to clean values like 100, 250, or 500 meters. Every square gets a reference made of a column letter and a row number, so B3 means the same cell to everyone on the incident. Pick the size by task. A hasty team sweeping trails takes bigger squares than a grid search line. One plan holds up to 1,000 squares, which keeps references short and the map readable.
Paint the teams
Add a team and drag across the squares that belong to it. Switch teams and keep painting in the next color. Up to 12 teams get distinct colors, and each team's name sits on its block of the map. A wrong stroke is one undo away.
Read the plan back
The plan counts what is assigned and what is not, so an orphaned square shows up before the briefing instead of after it. Copy the roster and you get plain text, one line per team with its squares ("Alpha: A1, A2, B1, B2"), ready to paste into the ICS‑204, the group chat, or the log.
Export and brief
Sectors render into the map exports. Print a PDF at true scale for the plans board, export an image for the screen, or hand the GeoJSON to the county GIS. The file carries the drawn area, the square size, the teams, and one polygon per assigned square, and the area survives the round trip back onto the map tomorrow.
The whole flow
- Draw the search area over the ground you were assigned.
- Split it into squares sized to the search type.
- Paint each team's squares and copy the roster.
- Export the map and brief.
FAQ
How many sectors can one plan hold?
Up to 1,000 squares per drawn area, each square one sector, split among up to 12 teams. At 250 meter squares that covers over 60 square kilometers, and the cap keeps references short and the briefing map readable.
Do drawn sectors replace the MGRS or USNG grid?
No, they answer different questions. The MGRS overlay is a shared coordinate language for the whole map, while sectors are task boundaries you draw for this incident. The two layer together, so teams navigate and report by grid reference while working the sector they were painted into.
Is the sector planner free for SAR teams?
Personal and non-commercial use is free; commercial use needs a paid license. Volunteer SAR work generally falls on the non-commercial side, and agencies that need a formal arrangement can contact sales@mapgridder.com.
Can GIS software read the sector plan?
Yes. The GeoJSON export carries the drawn area with its square size, teams, and assignments, plus one polygon per assigned square with its reference, team name, and color. Standard GIS tools open it directly, and the drawn area survives the round trip back onto the map.
The fastest way to judge it is with last month's incident. Open the sector planner, redraw that search area, and rebuild the assignments. If it takes more than five minutes, we want to hear about it.