MapGridder for SAR Teams: An Overview
August 9, 2026
SAR mapping has climbed a ladder over the past twenty years. Paper quads and acetate gave way to desktop GIS. Desktop GIS gave way to subscription mapping platforms, and one of those now sits in most team budgets. The platforms are capable. They are also priced like agency software, because that is what they are. MapGridder takes a different cut at the problem. It puts the map work of a search, from standard symbols to briefing exports, in a browser tab that a volunteer can open for nothing. Here is what that actually covers on a callout.
Start with the symbols
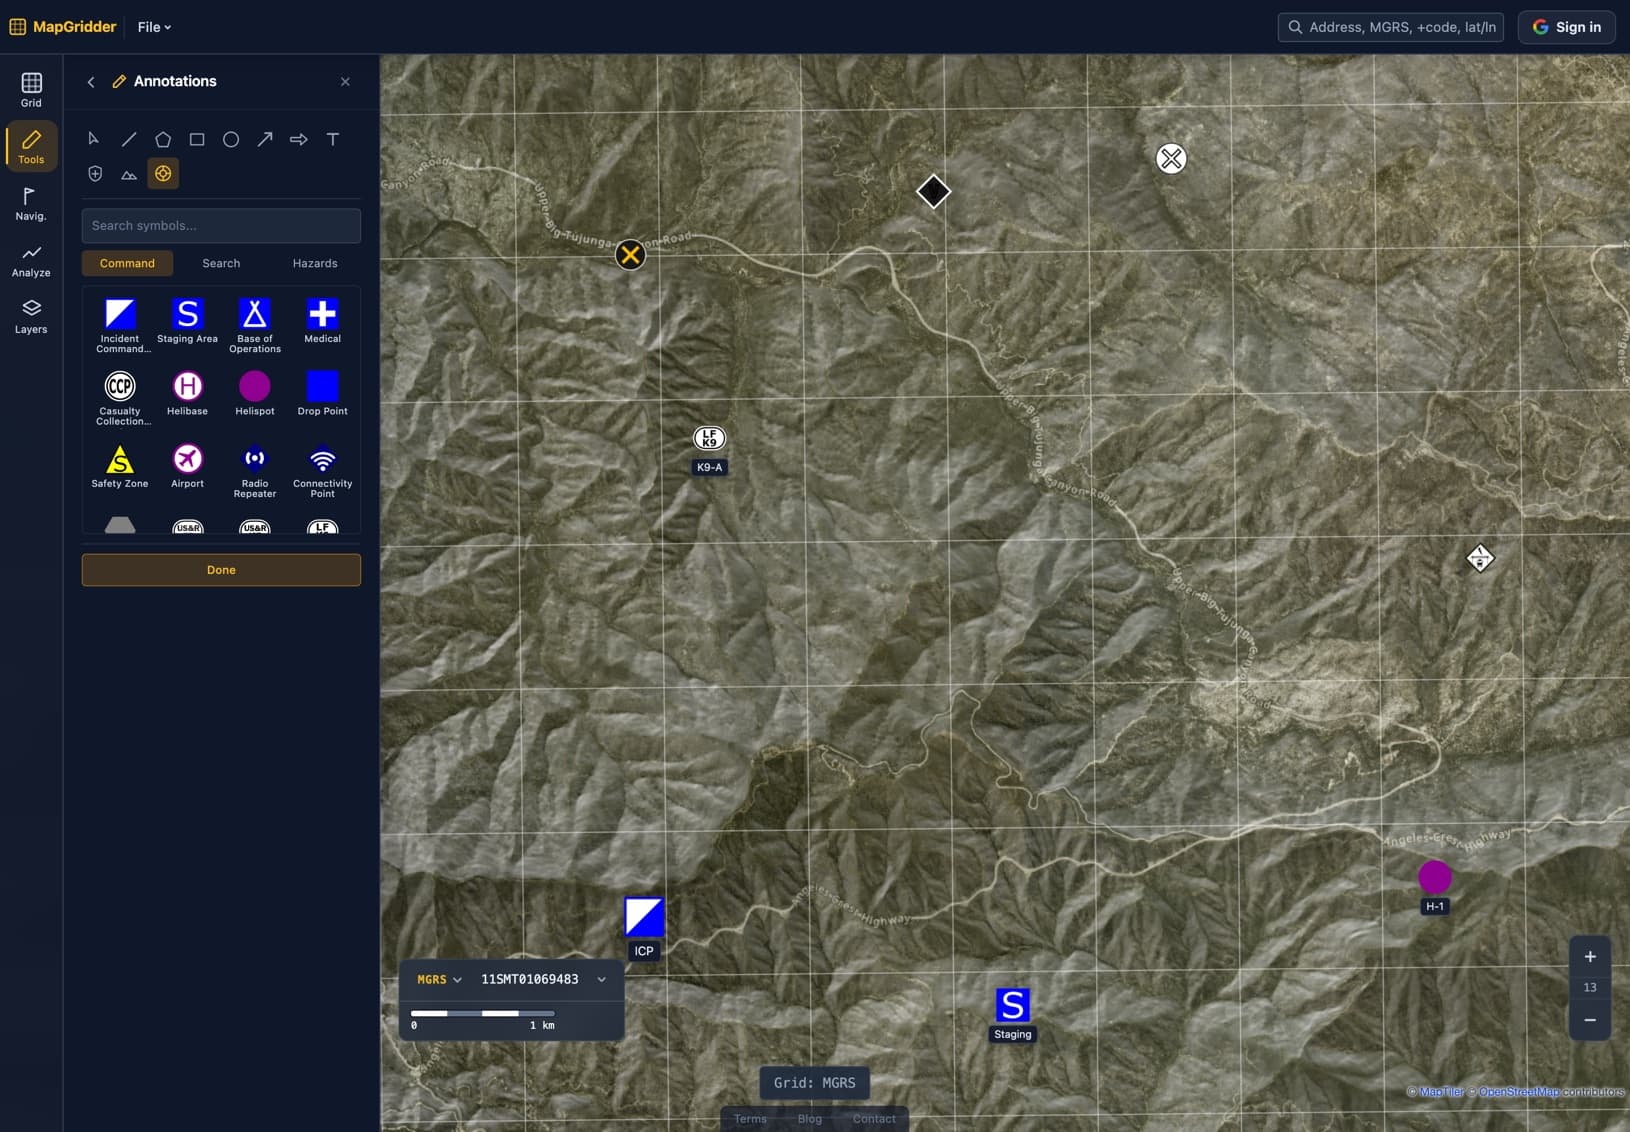
The catalog carries 65 symbols from the NAPSG incident symbology, the standard DHS built with the response community and FEMA US&R task forces brief from. Command posts, staging, helispots and the teams themselves. The wide-area search ladder from not searched through hasty, primary and secondary. Victim markers from detected through rescued, plus hazards, the FEMA damage scale and structure risk. When a neighboring team walks in at midnight, they read your map without a legend, because it is their symbology too.
One grid under everything
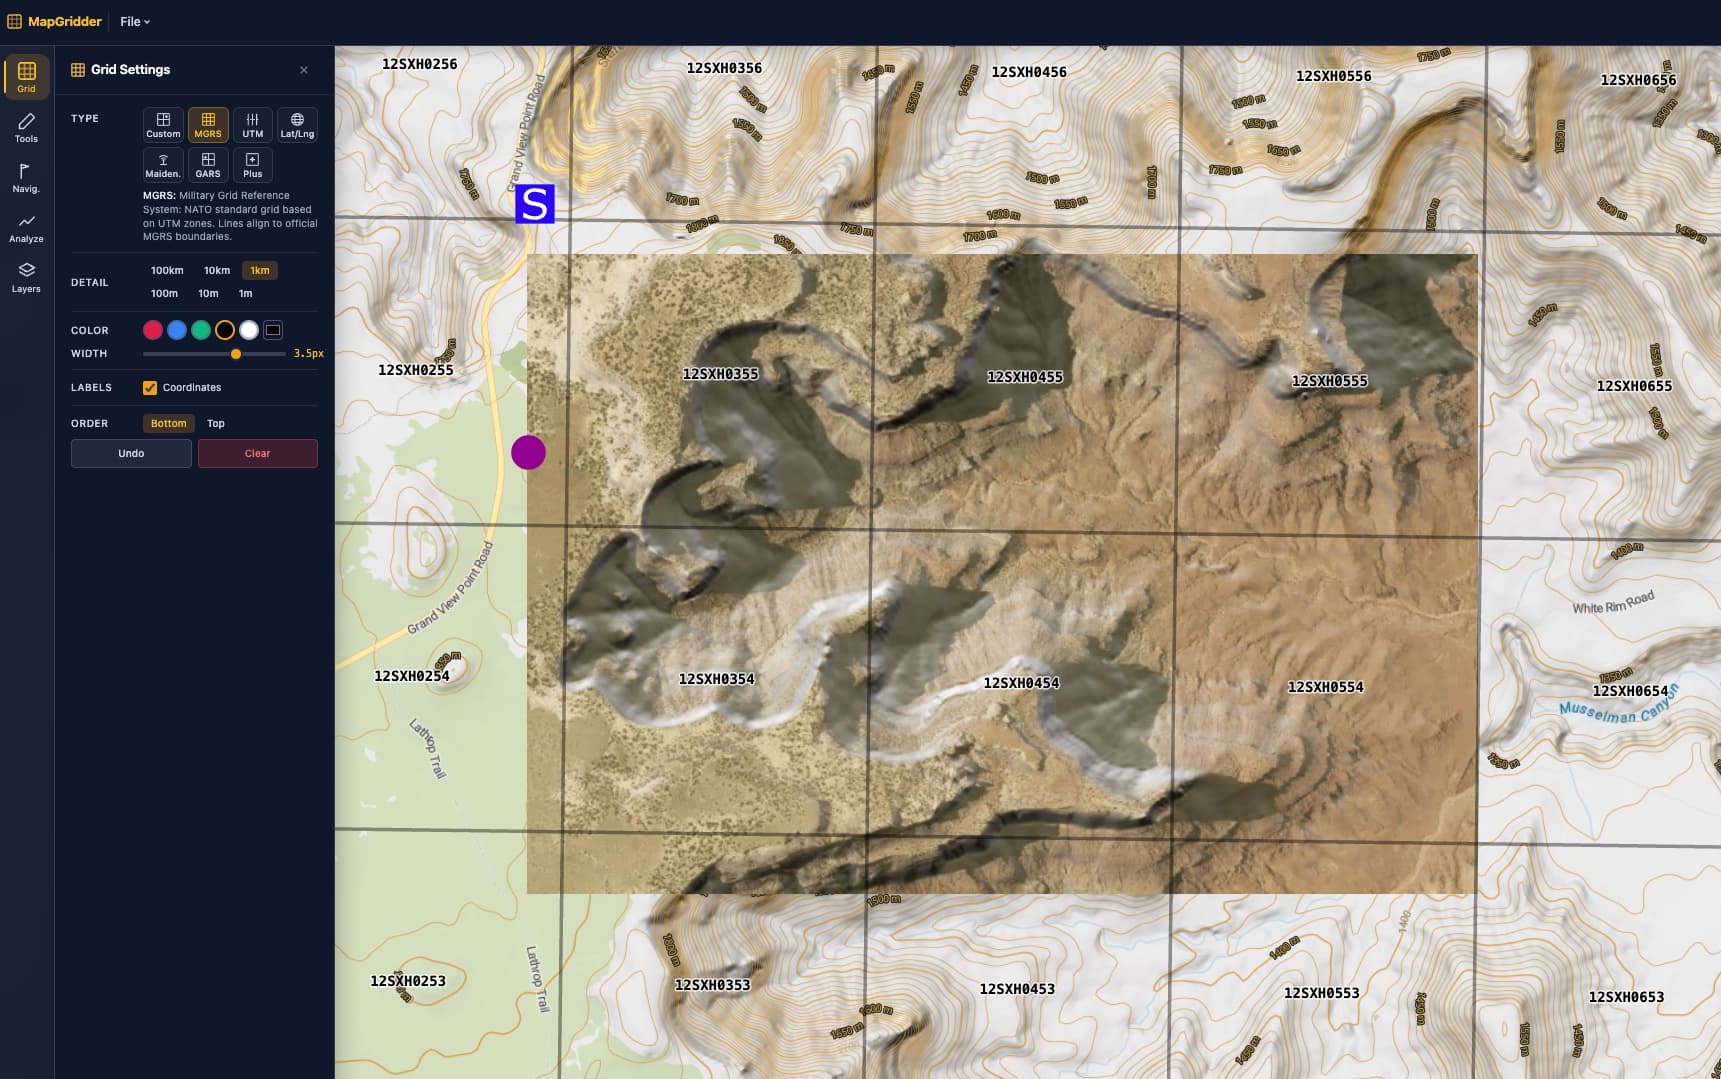
The MGRS overlay reads the same as USNG everywhere in the continental US, at precisions from 100 km squares down to 1 m. Turn it on once and grid discipline stops costing effort. Assignments, radio traffic and debrief notes all reference the same squares. The search bar takes any coordinates you throw at it. Grid reference, lat/long, Plus Code, a street address, try it. And a right click on any point copies its full coordinate set for the log.
Rings around the last known point
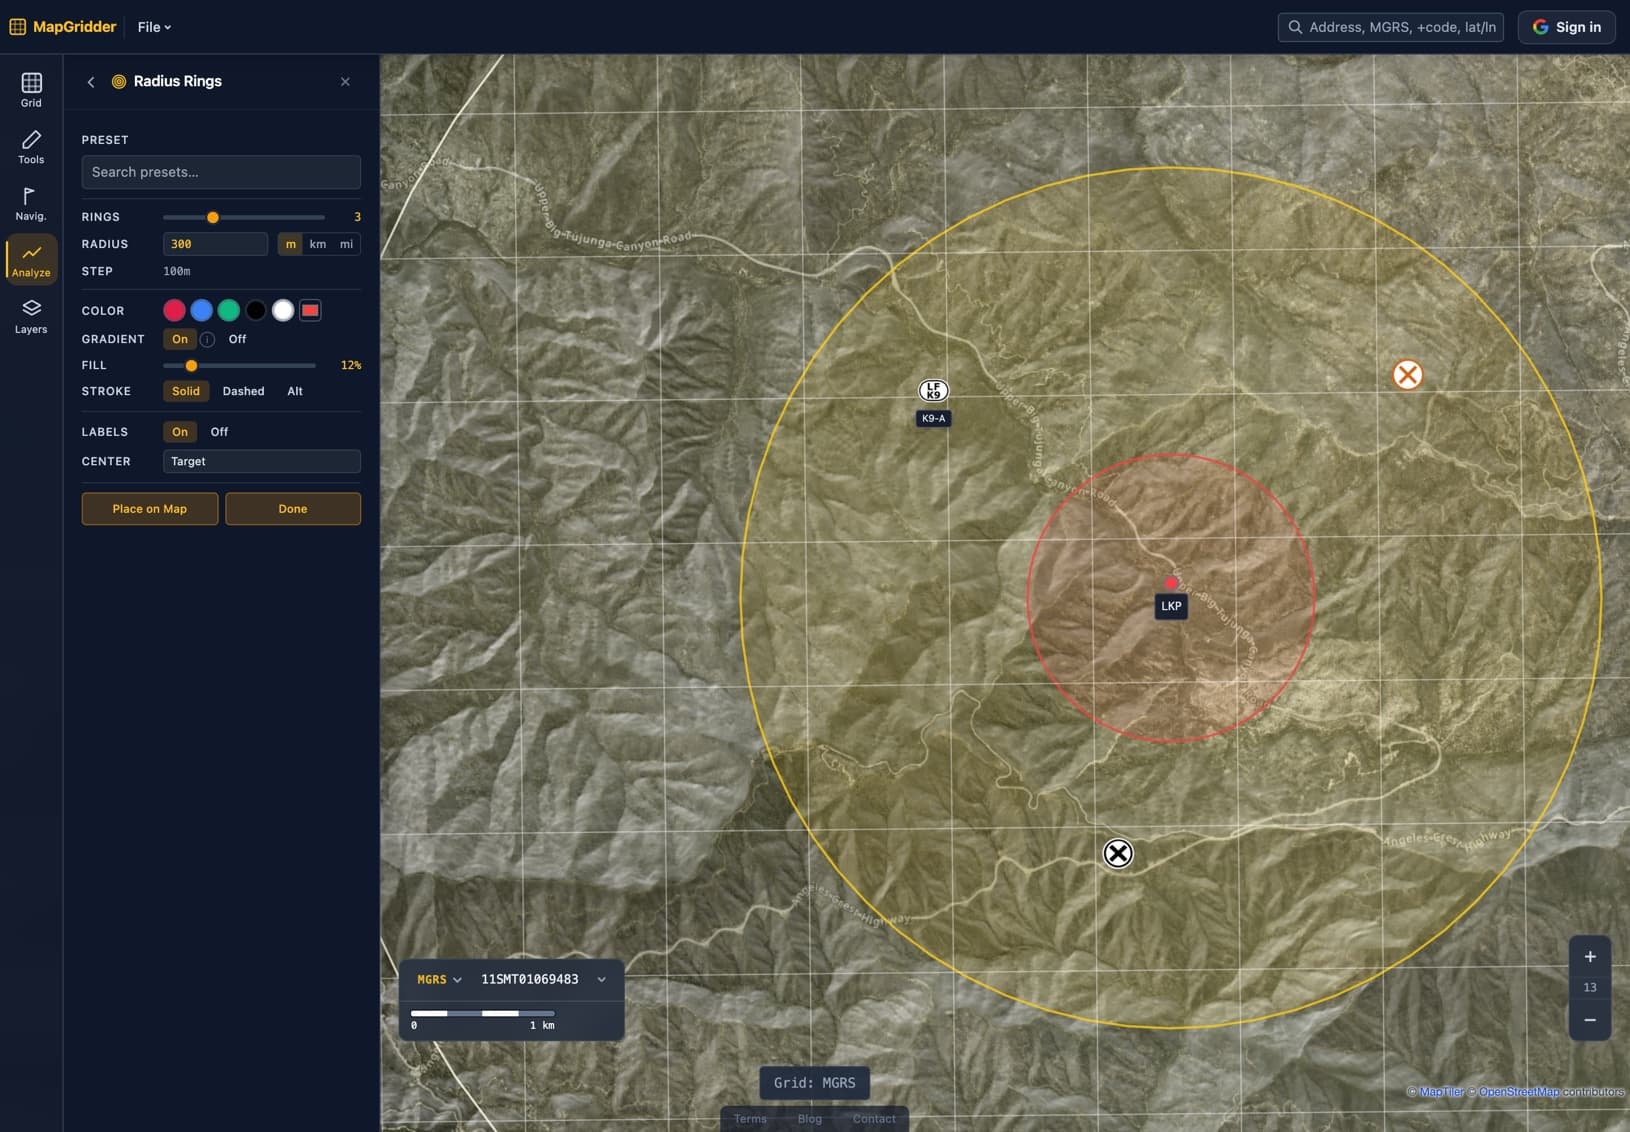
Containment starts with distances. Ring the LKP at the zones from your lost person behavior reference, or at whatever planning distances your unit trusts, and the map answers the first three questions of the night. Which roads cut the middle ring. Which trails leave the outer one. Where the traffic posts go. Mark the posts with symbols and move on to cutting segments.
Numbers for the night shift
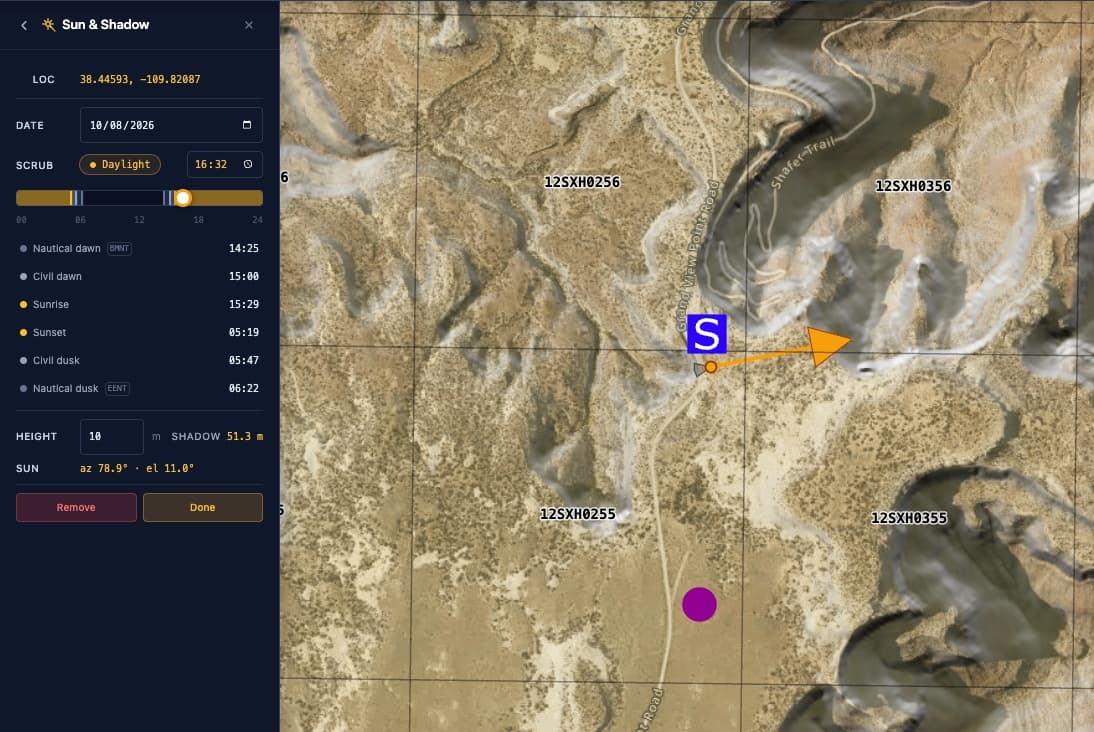
The night-ops decision deserves better than a glance at the sky. Sun analysis gives civil twilight and last light for the search area itself, and moon analysis adds moonrise and phase, so the 2200 briefing plans around real illumination. Weather draws under the same grid. An approaching cell has a grid reference instead of a vague direction, and the 48 hour forecast shows which operational period the rain will cost.
Terrain and imagery
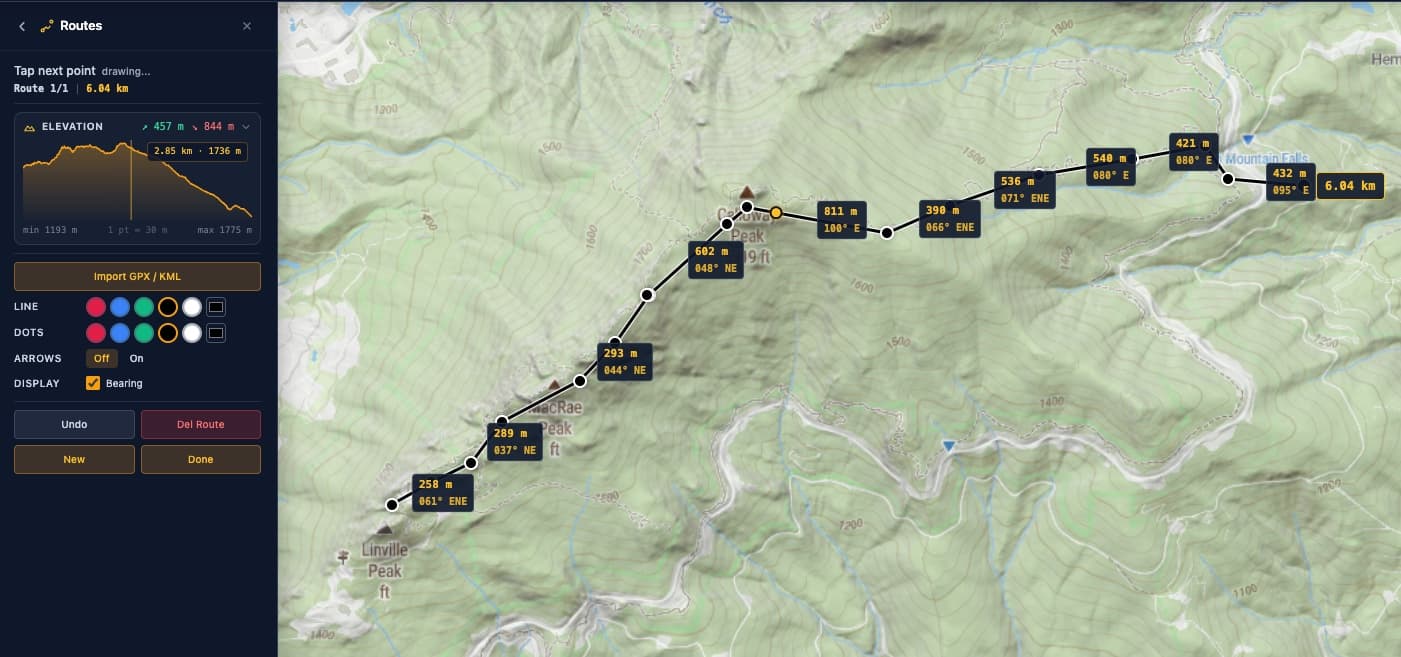
An elevation profile along a proposed route shows the climb before a tired team feels it. For structure work and mapped venues, a GRG or a georeferenced raster drops over the basemap and the grid stays on top. Everything stays on the one map you brief from.
Got a drone on the team?
Fly the area, take an aerial photo, and anchor it to the base map in a couple of minutes. The image becomes a layer under the grid, so what the drone saw an hour ago has grid references now. If your drone writes GeoTIFF, even better. Import the file and it places itself from the georeferencing inside it, no anchoring needed.
Tracks in, products out
After the operational period, import the GPX tracks from the team GPS units and lay them over the assigned segments. Coverage gets honest fast, including the gaps the debrief forms missed. When the paperwork needs a map, export a PDF at true scale for the plans board or an image for the briefing. The same data leaves as GeoJSON, which the county GIS reads without conversion.
What it costs
Personal and non-commercial use is free, and commercial use needs a paid license that runs less than half of what the established team mapping platforms charge. Agencies that want a formal arrangement or an on-premises deployment can write to sales@mapgridder.com. And the gap is closing: live team sharing and live location are on the near-term roadmap.
The best evaluation is a training day. Open the SAR symbols, set an LKP from a grid reference, and run your normal planning sequence. By lunch you will know which parts of the subscription your team actually uses.