Elevation Profiles for GPX Routes and Hikes
July 12, 2026
Every route I have ever regretted started the same way. The distance looked fine, the map looked flat enough, and then the trail went straight up for an hour. Distance is the number everyone shares. Elevation is the number that decides how your day actually goes.
So this update is about elevation, in two forms. A small profile chart that lives inside the route panel and follows whatever you draw or import, and a separate Height Profile tool for when you just want to know what the ground does between two points. I have been using both for my own weekend plans, and they have already talked me out of one genuinely bad idea.
The profile that lives in the route panel
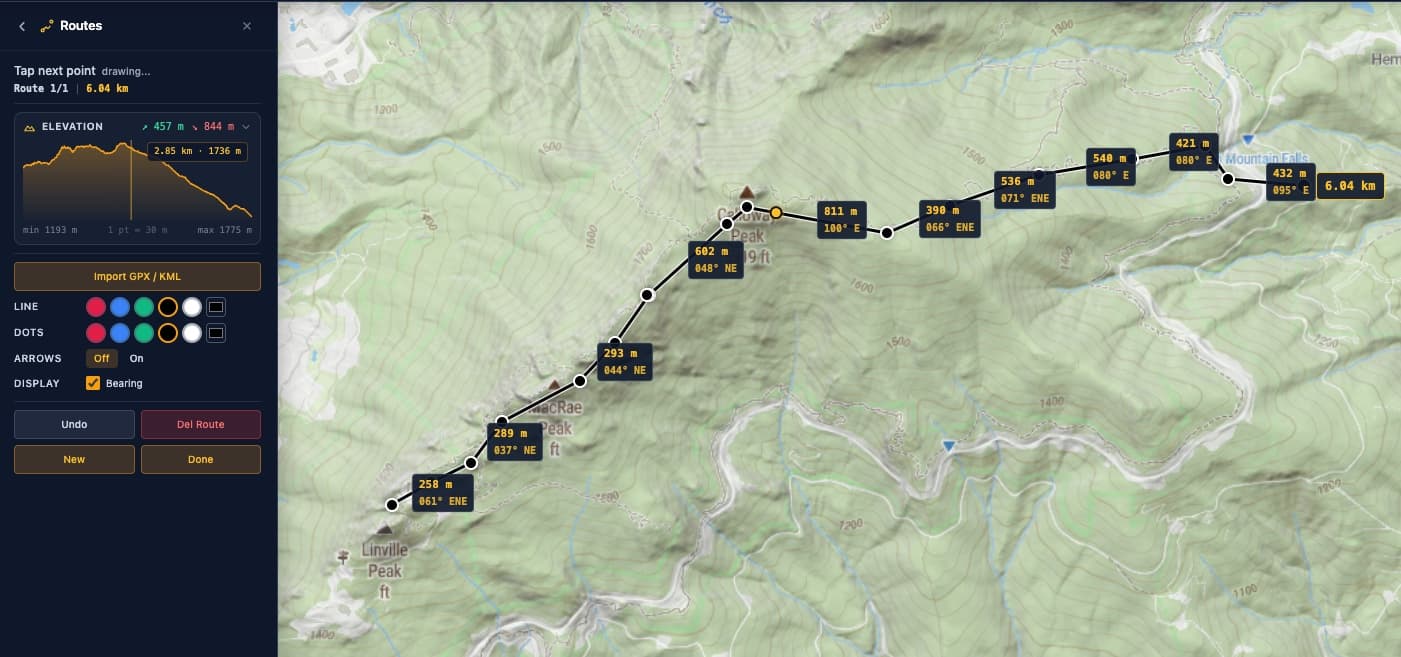
Open the route tool and start clicking points on the map, or press Import GPX / KML and load a file from Strava, Garmin, AllTrails, or wherever your tracks live. The moment the route has two points, an Elevation card appears in the panel and starts charting. Add a point, the chart updates. Drag a point somewhere else, it updates again.
The header shows total gain and total loss at a glance. Under the chart you get the lowest and highest points of the route. And this is the part I did not expect to like so much: run your finger or cursor along the chart and an amber dot rides the route line on the map, showing you exactly where that hill in the chart lives in the real world. No more squinting at a profile wondering which bump is which.
On a phone the card starts collapsed so the map stays big, but the gain and loss numbers stay visible in the header. Tap it when you want the full chart.
What I check before I commit to a route
Different sports read the same chart differently. A few honest examples from my own planning:
- Hiking: where the climb sits matters more than how big it is. 600 m of gain spread over a day is a nice walk. The same 600 m stacked into the first third of the route, with the group I usually hike with, is a mutiny. Now I can see it before anyone laces a boot.
- Mountain biking: I read profiles backwards. The descent is the point, the climb is the price. Scrubbing along the chart to find where the grade finally tips over, and seeing that exact spot marked on the map, is the fastest way I know to decide which direction to ride a loop.
- Trail running: gain per kilometer is the whole pacing plan. A quick look at the profile tells me where I will be walking with my hands on my knees and where I can actually run.
- Gravel and bikepacking: import the whole 200 km file and the passes stand out immediately. For the question of how many big climbs and in what order, one glance is exactly enough.
- Ski touring: a fast sense of how sustained a climb is and what the terrain does around it. For anything where steepness means risk, treat this as a first look and do your real planning with proper avalanche resources.
Two points, no route: the Height Profile tool
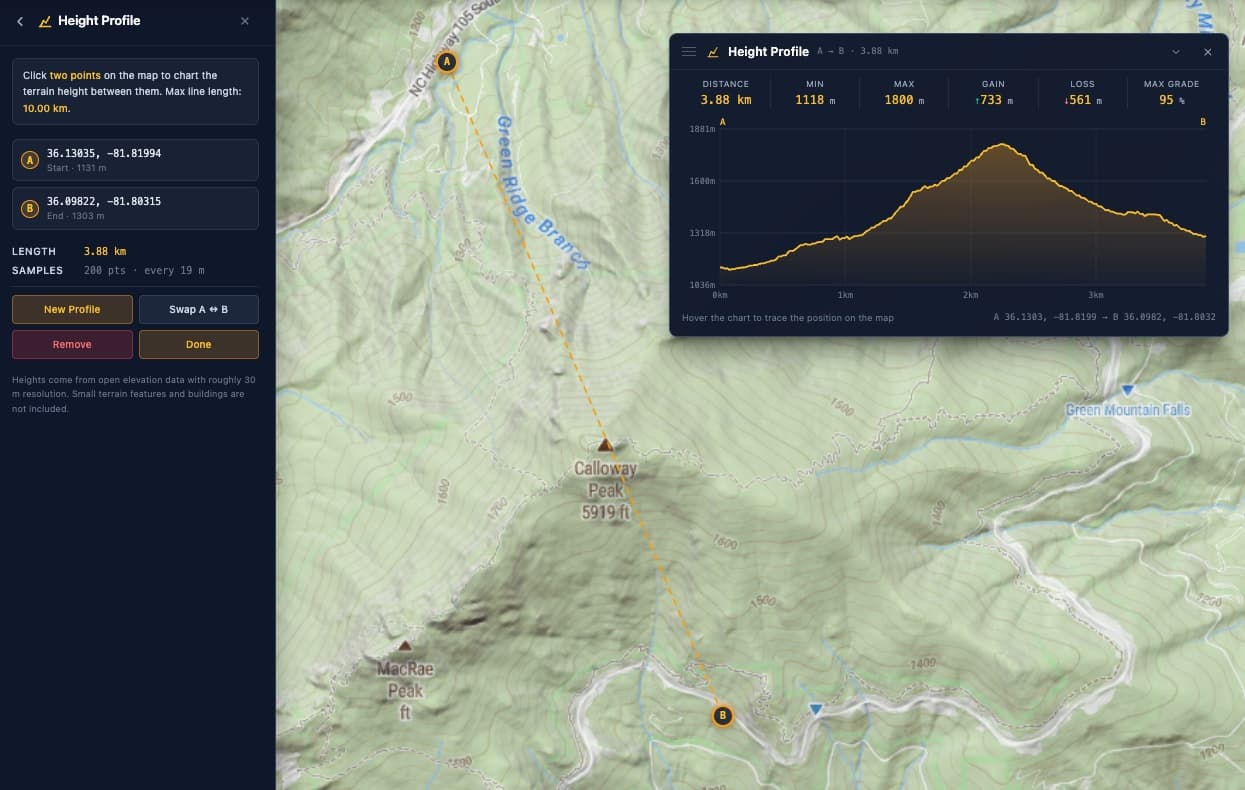
Sometimes there is no route yet. You are looking at the map thinking, what is actually between here and there. That is the Height Profile tool in the Analysis group. Click a start point, click an end point, and a chart pops up with the terrain between them: distance, lowest and highest point, gain, loss, and the steepest grade along the line.
I use it for the small questions that decide a plan. How steep is that shortcut really. Is there a hidden valley between the campsite and the ridge I want to be on for sunrise. Both endpoints drag, so you can slide the line around and watch the chart redraw.
The chart is a pinned window, and I mean properly pinned. Move it wherever you want, switch to the grid tool, measure something, draw on the map, and it stays put. Only its X closes it. Lines are capped at 10 km because past that, straight line profiles stop meaning much anyway. For longer questions, draw a route and use the panel chart above.
Try it on your own route
- Open the route tool and click out a route, or import a GPX or KML file you already have.
- Watch the Elevation card build the profile as you go.
- Hover or drag along the chart and follow the dot on the map.
- For a quick terrain check without a route, open the Height Profile tool and click two points.
Everything runs in your browser and your GPX file never leaves your machine.
Common questions
How do I see the elevation profile of a GPX file?
Open the map, go to Navigation and pick Route, then press Import GPX / KML and choose your file. The elevation profile appears right inside the route panel, with total gain and loss in the header and the lowest and highest points under the chart. The elevation is read in your browser, so your file is not uploaded anywhere.
Is there a limit on route length for the elevation profile?
No, any length works. Very long routes simply get a coarser chart. The panel shows the spacing between samples right under the chart, and once that spacing gets coarse it adds a low detail notice so you know short climbs can hide between samples.
How accurate is the elevation data?
The terrain data has a resolution of roughly 30 meters, which is plenty for reading climbs, descents, and total gain. It will not show a curb, a dip of a few meters, or a building. Treat the numbers as planning figures, not survey results.
Can I chart the terrain between two points without drawing a route?
Yes. The Height Profile tool in the Analysis group does exactly that. Click a start point and an end point up to 10 km apart and a detailed chart opens with distance, minimum, maximum, gain, loss, and the steepest grade. The chart stays pinned on screen while you use other tools and only closes when you press its X.